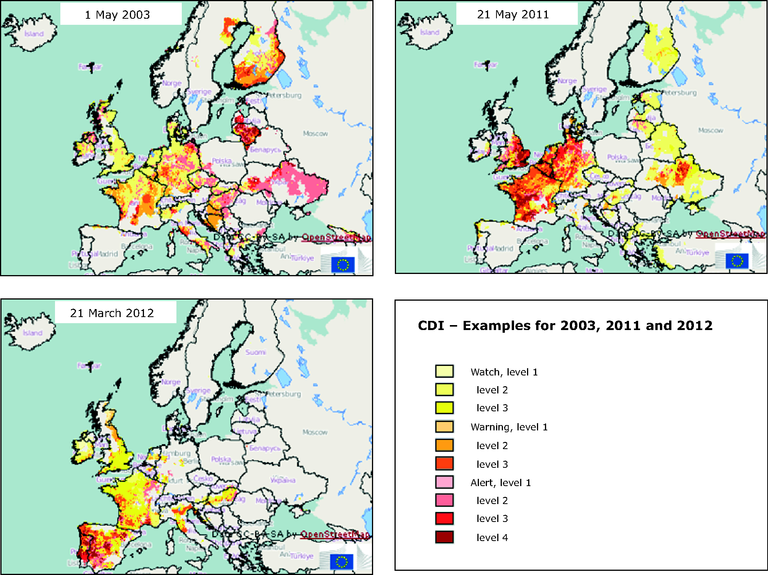
Mapping of drought conditions in Europe as calculated by the CDI (based on SPI, soil moisture and fAPAR) for top left 21 March 2012, top right 21 May 2011, and bottom left 1 May 2003. 2003 was known as a dry year for large parts of Europe.
A Combined Drought Indicator (CDI) for agricultural drought has been developed recently that provides for a structured combination of three indicators based on the cause–effect relationships between rainfall deficit (SPI), soil moisture anomaly, and impact on the vegetation canopy (fAPAR anomaly). According to the severity of the recorded impact, a watch, warning, or alert is issued. The CDI is targeted at agricultural drought impacts. A precipitation shortage is reflected in a watch. When the rainfall deficit translates into a soil moisture deficit, it is reflected in a warning. Finally, when reduced vegetation production is identified, an alert is issued . The CDI is updated on a 10-day basis and presented in the EDO.
Units
There are three classification levels: watch (when a relevant precipitation shortage is observed), warning (when the precipitation translates into a soil moisture anomaly), and alert (when these two conditions are accompanied by an anomaly in the vegetation condition).