All official European Union website addresses are in the europa.eu domain.
See all EU institutions and bodies
An official website of the European Union | How do you know?
Environmental information systems
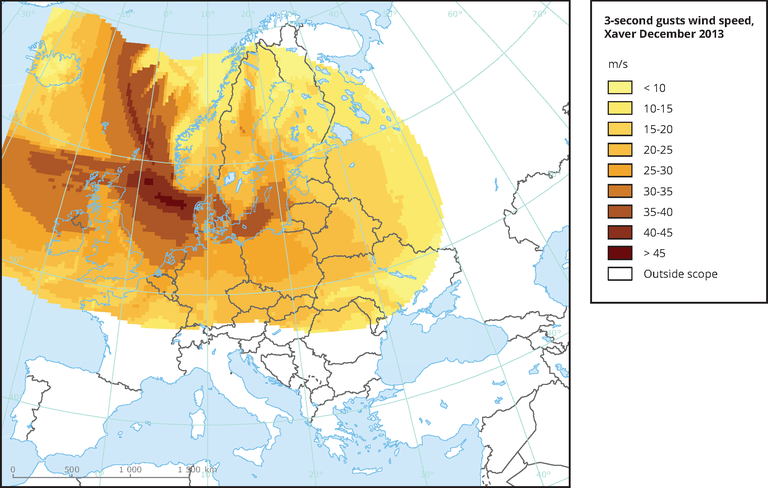
The storm footprint is defined by considering the highest 3 seconds wind gust (in m/s) during a 72 hours period . Data are obtained from the Met Office Integrated Data Archive System (MIDAS).