All official European Union website addresses are in the europa.eu domain.
See all EU institutions and bodies
An official website of the European Union | How do you know?
Environmental information systems
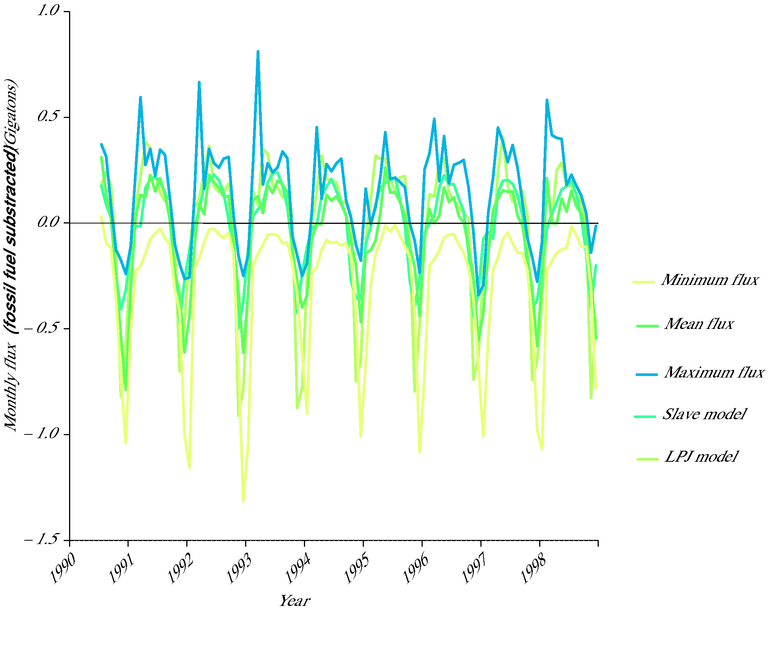
Note: The lines represent the results of two ecosystem models (LPJ and SLAVE), and the range (minimum, mean, maximum) of calculated terrestrial C flux (based on so-called inversed calculations considering atmospheric CO2 calculation)
Loading