All official European Union website addresses are in the europa.eu domain.
See all EU institutions and bodies
An official website of the European Union | How do you know?
Environmental information systems
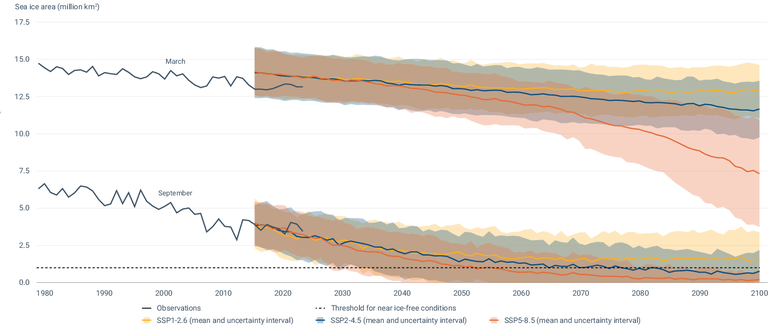
This figure combines two data sources.
The left part shows the observed change in Arctic sea ice are (individual observations and trend lines) over the period 1979 to 2023 for March (maximum ice cover) and September (minimum ice cover).
The right part shows projections of Arctic sea ice area in March and September from CMIP6 (Coupled Model Intercomparison Project Phase 6) simulations for three emissions scenarios. The thick lines denote the multimodel ensemble mean (24-27 models, depending on the scenario), and the shading shows the likely uncertainty interval (one standard deviation around the multimodel mean). The dashed line indicates a threshold for near ice-free conditions.
Loading