All official European Union website addresses are in the europa.eu domain.
See all EU institutions and bodies
An official website of the European Union | How do you know?
Environmental information systems
EN

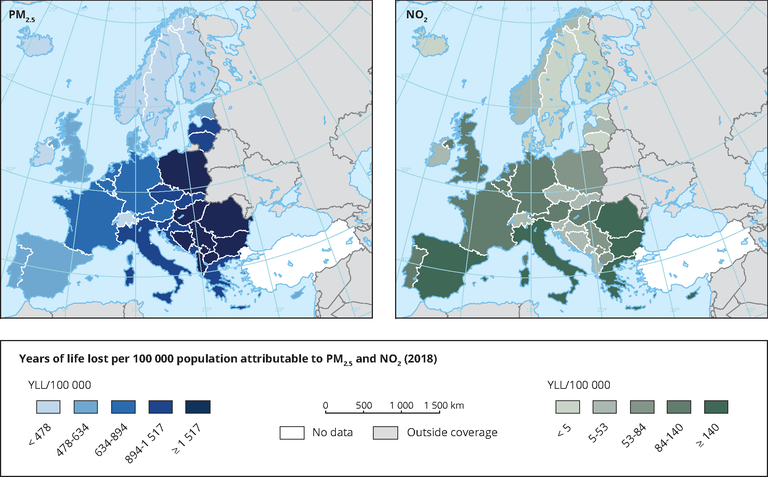
The maps show the number of years of life lost per country attributable to air pollution (PM2.5 left and NO2 right).
Loading