All official European Union website addresses are in the europa.eu domain.
See all EU institutions and bodies
An official website of the European Union | How do you know?
Environmental information systems
EN

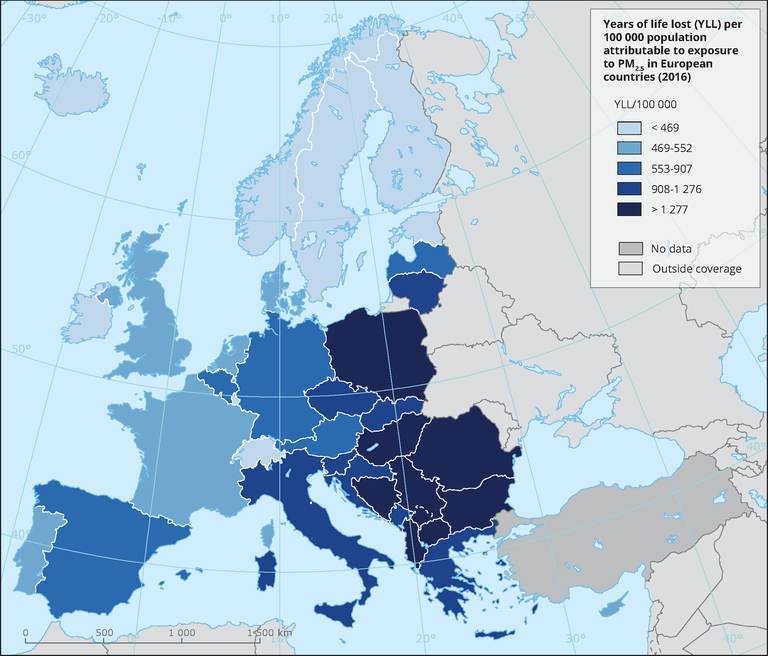
The map shows the number of years of life lost per 100 000 inhabitants attributable to exposure to PM2.5. Countries are ranked in quintiles.
Loading