All official European Union website addresses are in the europa.eu domain.
See all EU institutions and bodiesAn official website of the European Union | How do you know?
Environmental information systems
EN
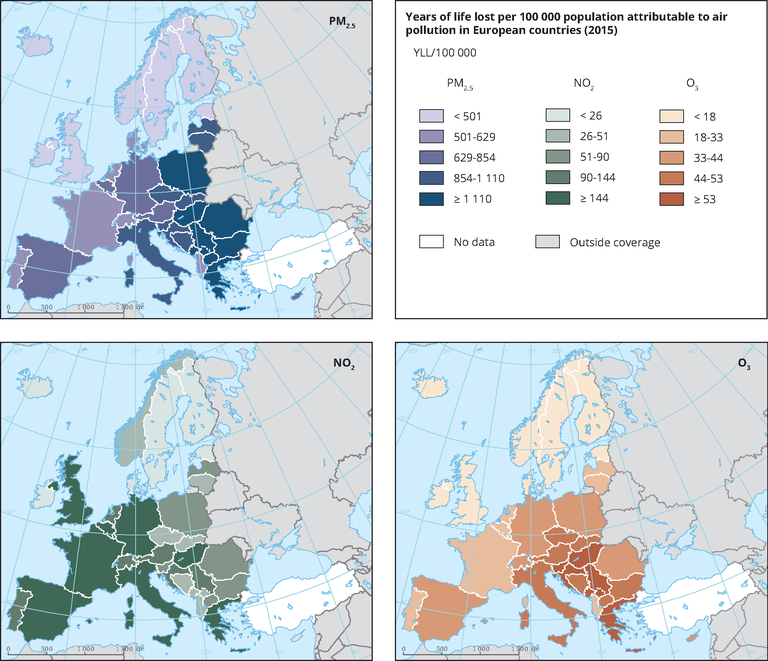
The maps show the number of years of life lost per country attributable to air pollution (PM 2.5 left, NO2 center and O3 right).
Loading