All official European Union website addresses are in the europa.eu domain.
See all EU institutions and bodiesAn official website of the European Union | How do you know?
Environmental information systems
EN
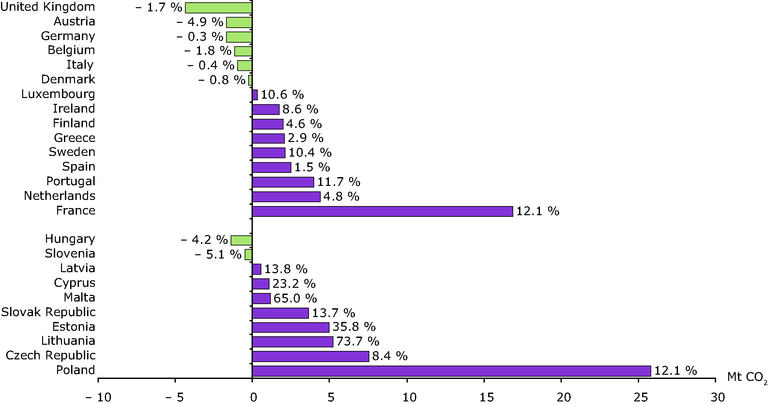
The CO2 emissions of the trading sector were calculated on the assumption that the share of the trading sector in the Member States total CO2 emissions will not change until 2007
Loading