next
previous
items

Figure

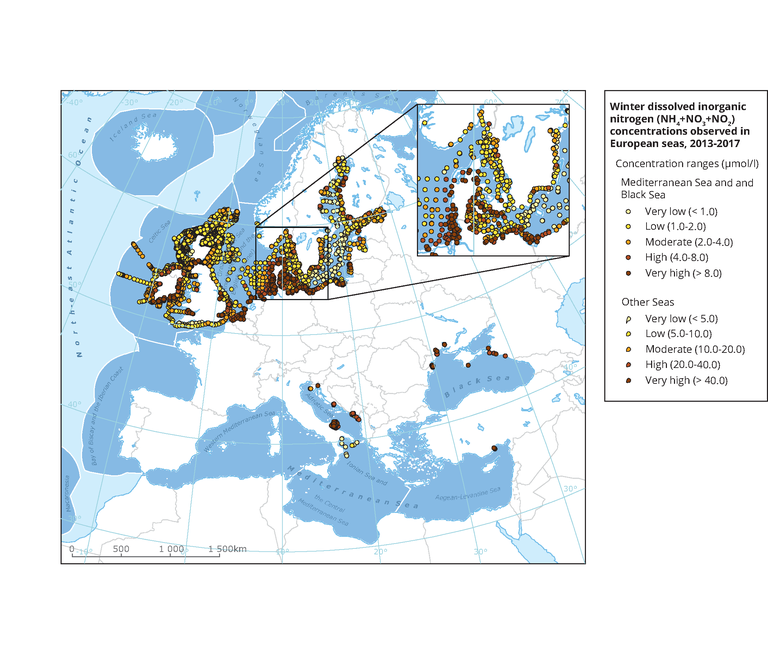
Dissolved inorganic nitrogen concentrations in European seas

Figure Created 17 Oct 2014 Published 03 Mar 2015 Last modified 23 Nov 2020
1 min read
This is an old version, kept for reference only.

Go to latest version
This page was archived on 23 Nov 2020 with reason: Other (New version data-and-maps/figures/winter-dissolved-inorganic-nitrogen-ammonium-1 was published)
The map shows the winter dissolved inorganic nitrogen (DIN) concentrations in European coastal and open waters in 2012. The class boundaries, “high” (red), “moderate” (orange) and “low” (yellow) concentration are determined by the 80/20 percentiles of the DIN data set for the years 2007 to 2012 in each regional sea.

European data

Metadata

Permalinks

Geographic coverage

Temporal coverage

Document Actions