All official European Union website addresses are in the europa.eu domain.
See all EU institutions and bodies
An official website of the European Union | How do you know?
Environmental information systems
Total waste generation in the EU (excluding major mineral waste), indexed to 2010, and compared with GDP, 2010-2020
Chart (static)
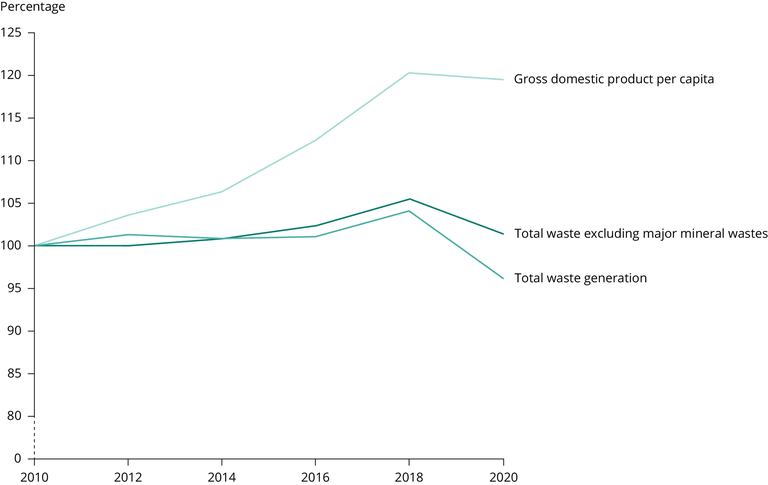
GDP, gross domestic product.
Downloads
Data sources
Metadata
More info
Loading
- Population change - Demographic balance and crude rates at national level (demo_gind)
- Waste generation and treatment (env_wasgen)
- GDP and main components (output, expenditure and income)(nama_10_gdp)
- Austria
- Belgium
- Bulgaria
- Croatia
- Cyprus
- Czechia
- Denmark
- Estonia
- Finland
- France
- Germany
- Greece
- Hungary
- Ireland
- Italy
- Latvia
- Lithuania
- Luxembourg
- Malta
- Netherlands
- Poland
- Portugal
- Romania
- Slovakia
- Slovenia
- Spain
- Sweden
- United Kingdom
2010-2018
Methodology
Raw data for waste generation (total and excluding major mineral wastes), population and GDP was retrieved from Eurostat. Eurostat aggregates for EU-28 were used. Data on waste generation contain all Statistical classification of economic activities in the European Community (NACE) activities and households. Frequency of data publishing varies from every two years (for waste generation) to every year (for population and GDP).
The aggregated figures are indexed to 2010, which means that the figure for each year is divided by the figure for 2010 and then multiplied by 100.