All official European Union website addresses are in the europa.eu domain.
See all EU institutions and bodiesAn official website of the European Union | How do you know?
Environmental information systems
EN
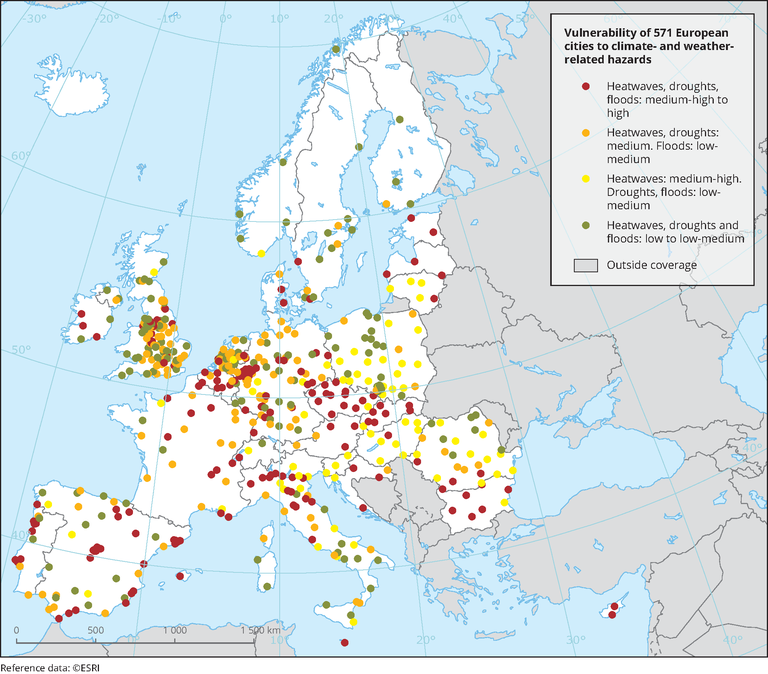
The map shows the vulnerability of European cities (selected) to climate hazards: heatwaves, droughts and floods
Loading