All official European Union website addresses are in the europa.eu domain.
See all EU institutions and bodiesAn official website of the European Union | How do you know?
Environmental information systems
EN
- БългарскиBG
- češtinaCS
- HrvatskiHR
- danskDA
- NederlandsNL
- ελληνικάEL
- EnglishEN
- eestiET
- SuomiFI
- FrançaisFR
- DeutschDE
- magyarHU
- ÍslenskaIS
- italianoIT
- LatviešuLV
- lietuviųLT
- MaltiMT
- NorskNO
- polskiPL
- PortuguêsPT
- RomânăRO
- slovenčinaSK
- SlovenščinaSL
- EspañolES
- SvenskaSV
- TürkçeTR
Trends in the use of materials and material productivity in EU-12 and EU15
Chart (static)
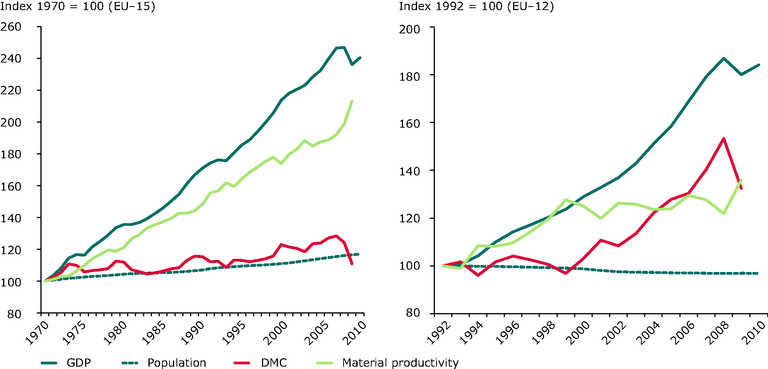
This figure shows the changes of GDP, Population, DMC and Material Productivity for EU15 and EU12 between 1970 and 2011/2009 respectively 1992 and 2011/2009

Downloads
Data sources
Metadata
More info
Loading
- GDP in millions of 2011 US$
- Material flow accounts
- Material flow data (DMI and TMR)
- Material flow accounts 1970-1999, EU-15
- Greece
- Portugal
- Spain
- United Kingdom
- Netherlands
- Belgium
- Germany
- France
- Italy
- Finland
- Denmark
- Sweden
- Austria
- Luxembourg
- Ireland
1970-2011
Methodology
The methodology for the calculation of DMI / DMC was revised by Eurostat in 2007. In this figure, the data are calculated after the revised methodology from 2000 on. For the DMC Data before 2000: EU15: IFF database, EU12: WI database. Therefore, the data set compromises the consistency in order to provide an extended temporal coverage.