All official European Union website addresses are in the europa.eu domain.
See all EU institutions and bodiesAn official website of the European Union | How do you know?
Environmental information systems
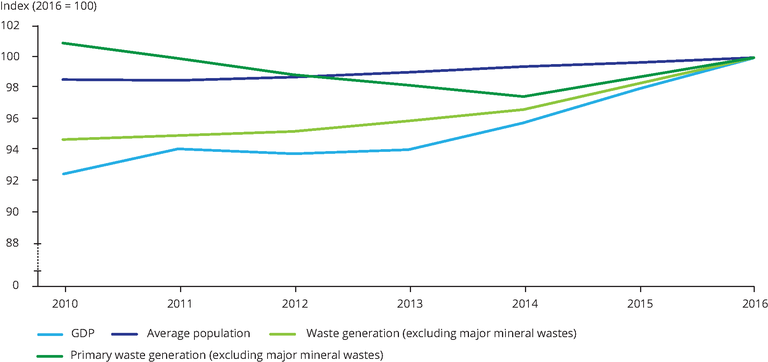
Trends in waste generation (excluding major mineral wastes), economic development and population, EEA-33
Chart (static)
The figure shows the generation of total waste excluding major mineral waste compared to the developments in GDP and population.

Downloads
Data sources
Metadata
More info
Loading
- Population change - Demographic balance and crude rates at national level (demo_gind)
- Annual national accounts (nama10)
- Waste generation and treatment (env_wasgen)
- Austria
- Belgium
- Bulgaria
- Croatia
- Cyprus
- Czechia
- Denmark
- Estonia
- Finland
- France
- Germany
- Greece
- Hungary
- Iceland
- Ireland
- Italy
- Latvia
- Lithuania
- Luxembourg
- Malta
- Netherlands
- Norway
- Poland
- Portugal
- Romania
- Slovakia
- Slovenia
- Spain
- Sweden
- United Kingdom
2010-2016
Methodology
The data was exctracted from the different Eurostat databases and indexed to 2016 = 1. Turkey is excluded because data on primary waste is not available for 2010-2016. Liechtenstein is excluded because GDP data is not available for the country. Switzerland is excluded because data on total waste and primary waste is not available. Data on total as well as primary waste (excluding major mineral wastes) are only reported for even years. Waste data for uneven years are therefore linearly interpolated.
