All official European Union website addresses are in the europa.eu domain.
See all EU institutions and bodiesAn official website of the European Union | How do you know?
Environmental information systems
EN
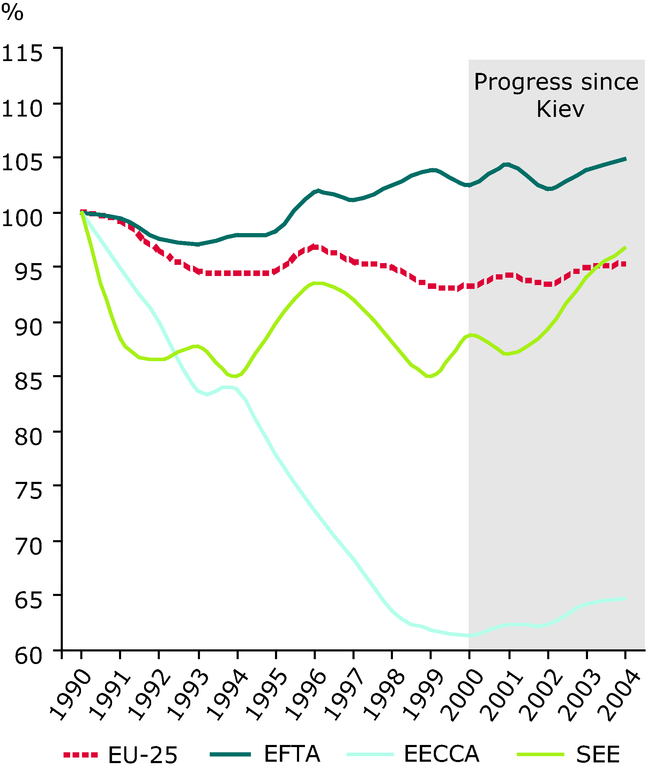
Total greenhouse gas emissions are based on sectoral reported data by gas, mostly to the UNFCCC
Loading