All official European Union website addresses are in the europa.eu domain.
See all EU institutions and bodiesAn official website of the European Union | How do you know?
Environmental information systems
EN
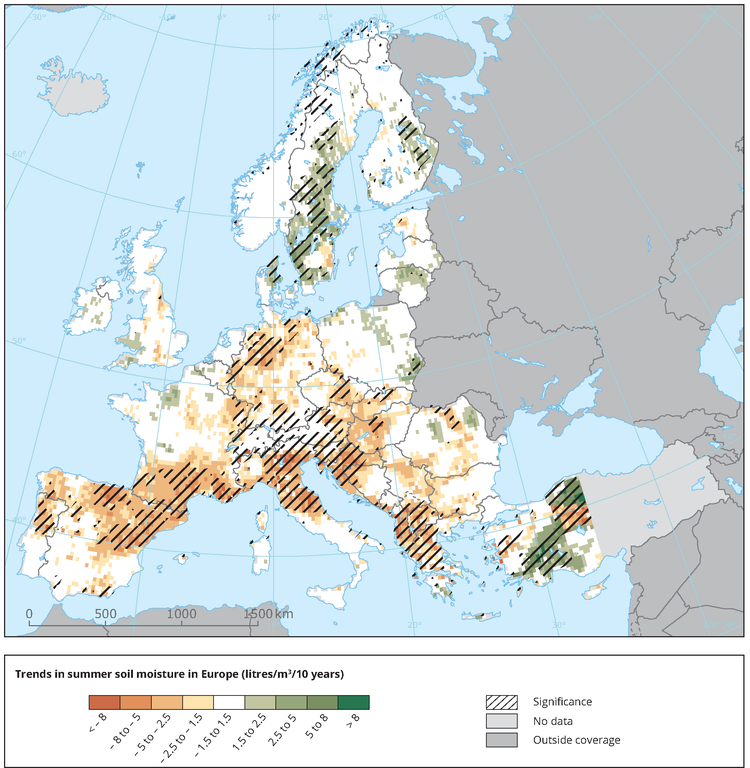
Soil moisture content was modelled using a soil moisture balance model in the upper soil horizons (up to 1 m).
Loading