All official European Union website addresses are in the europa.eu domain.
See all EU institutions and bodiesAn official website of the European Union | How do you know?
Environmental information systems
EN
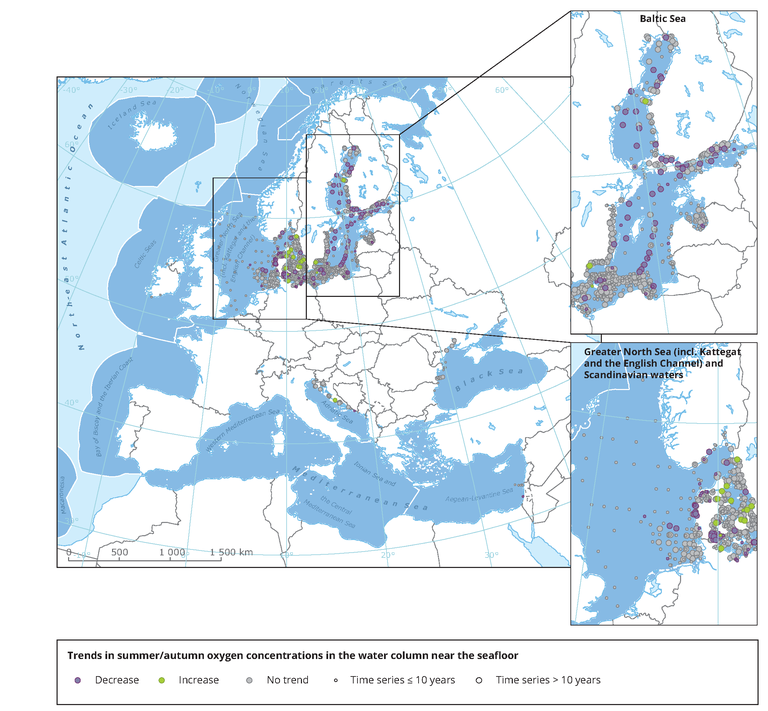
The map shows trends per station in dissolved oxygen concentrations in the water column near the seafloor, observed in summer/autumn of the years 1990-2017. Purple: significant decrease; green: significant increase; grey: no significant trend. Small symbols: ≤10 years of data; large symbols: >10 years of data.
Loading