All official European Union website addresses are in the europa.eu domain.
See all EU institutions and bodiesAn official website of the European Union | How do you know?
Environmental information systems
EN
Loading
All official European Union website addresses are in the europa.eu domain.
See all EU institutions and bodiesChart (static)
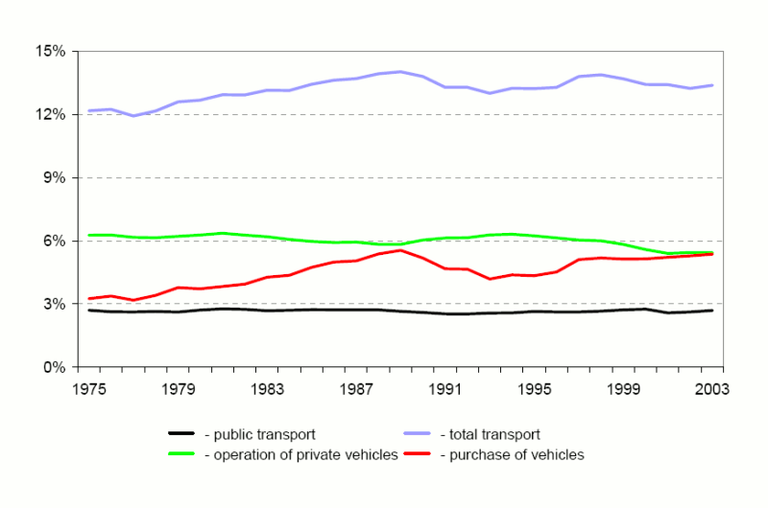
The chart is based on data from Denmark, Italy, Finland, and United Kingdom. Incomplete time series from many other countries suggest that the chart above is roughly representative for the whole EU. The UK is somewhat unrepresentative for the whole area, see figure 2. Public transport' includes transport by train, bus, taxi, ferries, and aircraft.