All official European Union website addresses are in the europa.eu domain.
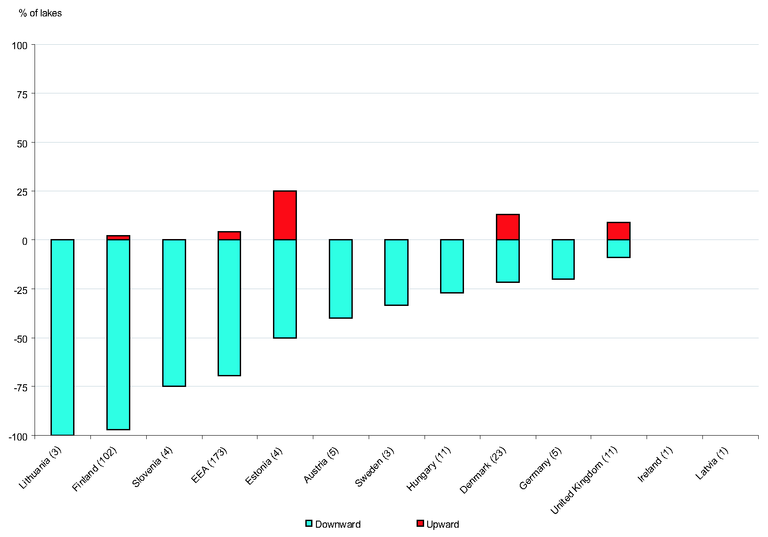
See all EU institutions and bodiesNumber of lake stations for each country given in brackets
Loading
All official European Union website addresses are in the europa.eu domain.
See all EU institutions and bodiesChart (static)
Number of lake stations for each country given in brackets

Consistent time series (1992 to 2003) except for Lithuania (1993 to 2003) and Netherlands (1992 to 2000).