All official European Union website addresses are in the europa.eu domain.
See all EU institutions and bodiesAn official website of the European Union | How do you know?
Environmental information systems
EN
- БългарскиBG
- češtinaCS
- HrvatskiHR
- danskDA
- NederlandsNL
- ελληνικάEL
- EnglishEN
- eestiET
- SuomiFI
- FrançaisFR
- DeutschDE
- magyarHU
- ÍslenskaIS
- italianoIT
- LatviešuLV
- lietuviųLT
- MaltiMT
- NorskNO
- polskiPL
- PortuguêsPT
- RomânăRO
- slovenčinaSK
- SlovenščinaSL
- EspañolES
- SvenskaSV
- TürkçeTR
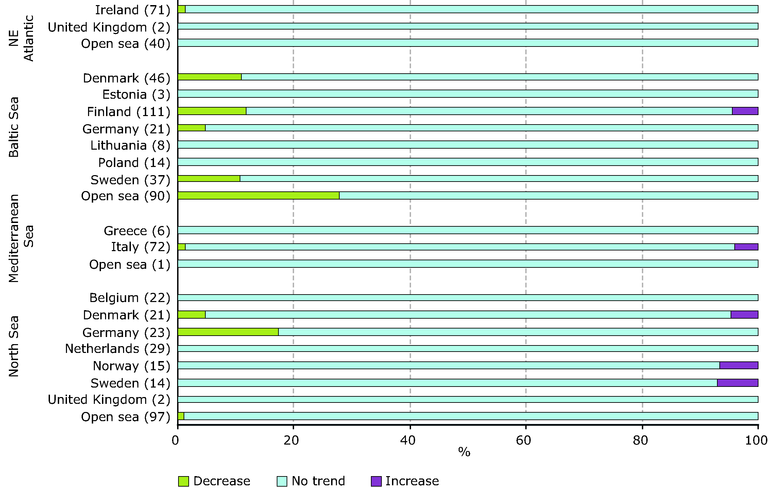
Trends in mean winter oxidised nitrogen concentrations in the Atlantic Ocean, Baltic Sea, Greater North Sea, Skagerrak and part of the Mediterranean in 1985-2005
Chart (static)
Numbers in parentheses indicate number of stations included in the analysis for each country
Downloads
Data sources
Metadata
More info
Loading
Belgium, Denmark, Estonia, Finland, Germany, Greece, Ireland, Italy, Lithuania, Marine Baltic sea, Marine Mediterranean sea, Marine North sea, North Atlantic Ocean, Netherlands, Norway, Poland, Sweden, United Kingdom
1985-2005
How to read the graph: in the North Sea, a little under 20 % of German stations identified a decrease of oxidised nitrogen concentrations. For some countries the data include stations with observations made in 2005, for some only up to 2004. The full data set is available at: http://themes.eea.europa.eu/IMS/ISpecs/ISpecification20041007132008/IAssessment1116503188454/view_ content [Accessed 23 June 2009] Countries included in the analysis: Belgium, Denmark, Estonia, Finland, Germany, Greece, Ireland, Italy, Latvia, Lithuania, Netherlands, Norway, Poland, Sweden and the United Kingdom. Bulgaria, France, Iceland, Malta, Portugal, Romania, Slovenia, Spain and Turkey reported time series of less than five years duration.