All official European Union website addresses are in the europa.eu domain.
See all EU institutions and bodies
An official website of the European Union | How do you know?
Environmental information systems
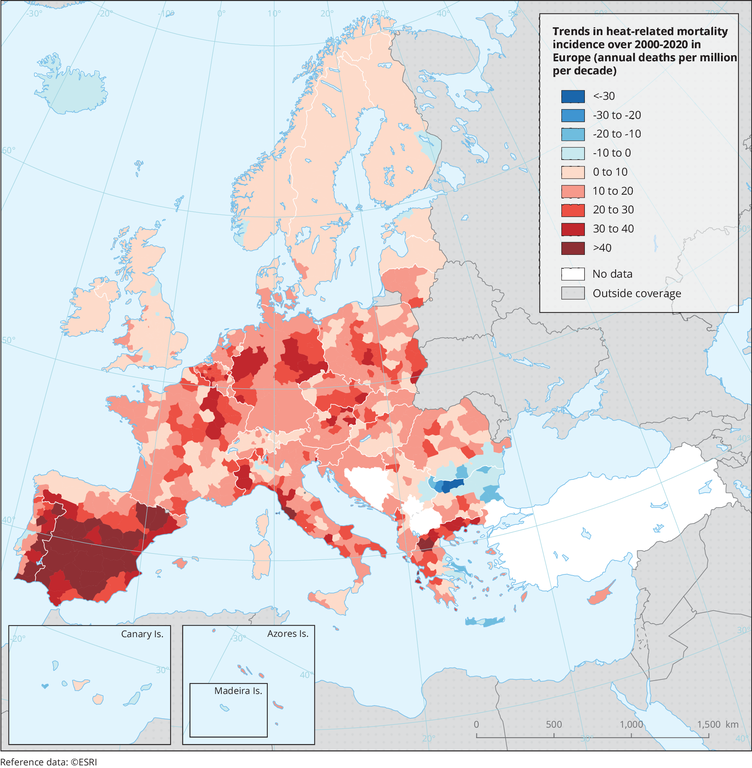
The map shows the trend in heat attributable mortality incidence (annual deaths/million/decade) for the general population, 2000-2020.
Loading