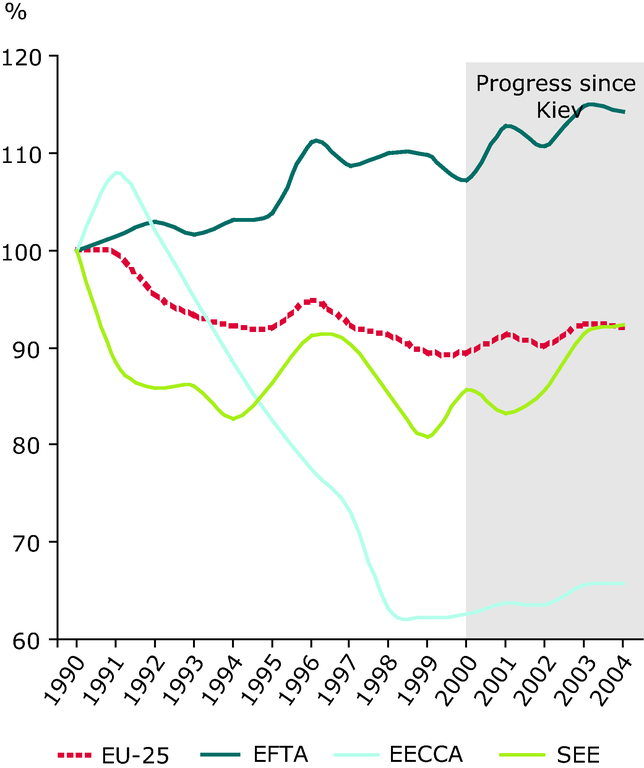
Figure
Trends in energy-related greenhouse gas emissions, excluding transport, 1990-2004
Metadata
Additional information
Transport emissions seem to be included under 'energy industries'. Because of the significant impact (i.e. 2/3 of the total GHG emissions) of the Russian Federation on the overall development for the EECCA countries, the trends shown in the chart above should be treated with some caution. The volume of emissions in million tonnes of CO2equivalents in 1990 was: EU25 = 3 294; EECCA = 3 650 (including transport from the Russian Federation); SEE = 396; EFTA = 47.
Permalinks
- Permalink to this version
- D4AA1B23-115B-4E22-8A4D-9F8D541D82A5
- Permalink to latest version
- 6B8AF19E-7FC8-43BF-BC6D-0B58C8727A30
Geographic coverage
For references, please go to https://www.eea.europa.eu/data-and-maps/figures/trends-in-energy-related-greenhouse-gas-emissions-excluding-transport-1990-2004 or scan the QR code.
PDF generated on 27 Jan 2021, 10:40 AM
Document Actions
Share with others