All official European Union website addresses are in the europa.eu domain.
See all EU institutions and bodies
An official website of the European Union | How do you know?
Environmental information systems
EN

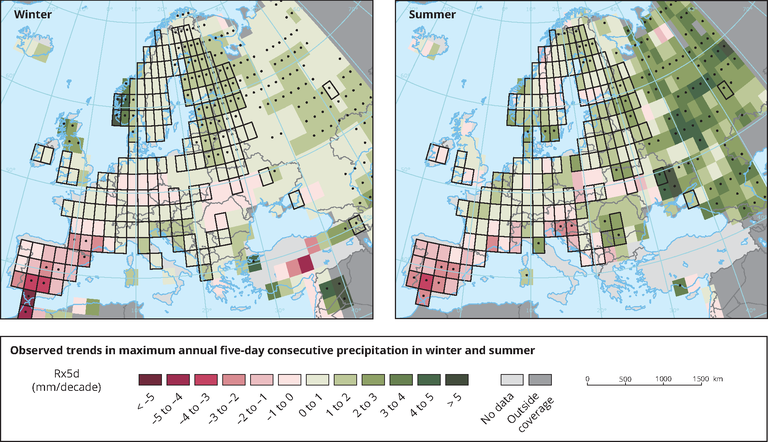
The figure shows the observed trend in maximum annual five day precipitation over Europe between 1960 and 2018 for Winter (December-January-February) and Summer (June-July-August). The change is expressed in mm/decade.
Grid boxes outlined in solid black contain at least three stations and so are likely to be more representative of the grid box. Significant (at the 5% level) long-term trend is shown by a black dot.
Loading