All official European Union website addresses are in the europa.eu domain.
Map (static)Published 15 Sept 2015Modified 20 Sept 2024
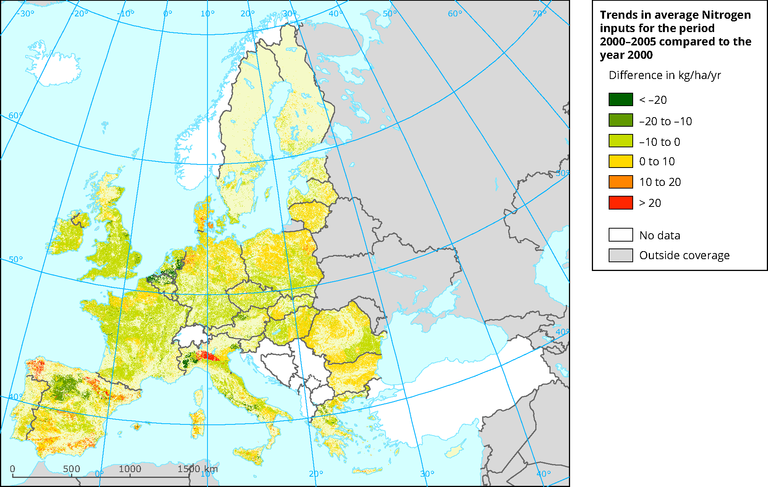
kg/ha/yr