All official European Union website addresses are in the europa.eu domain.
See all EU institutions and bodiesAn official website of the European Union | How do you know?
Environmental information systems
EN
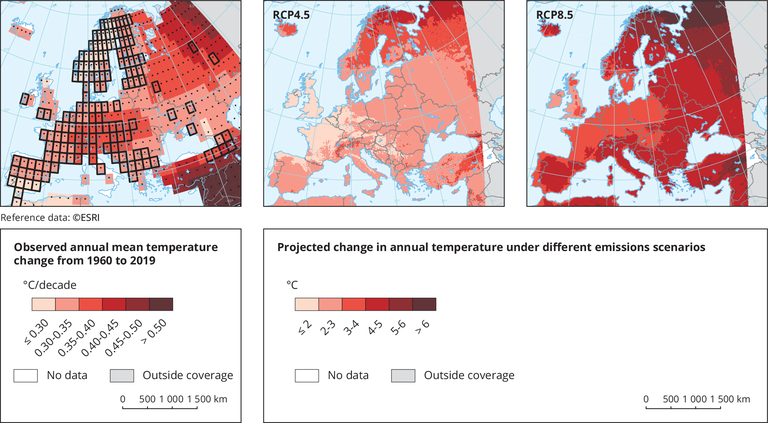
Left panel: boxes outlined in black indicate areas with at least three stations, so are more likely to be representative; areas with significant long-term trends are indicated by black dots.
Right panel: projected changes in near-surface air temperature by the period 2071-2100, compared with 1971-2000 for RCP4.5 (Representative Concentration Pathway) and 8.5 emissions scenarios; simulations are based on the multi-model ensemble average of simulations of the EURO-CORDEX initiative.
Loading