All official European Union website addresses are in the europa.eu domain.
See all EU institutions and bodiesAn official website of the European Union | How do you know?
Environmental information systems
EN
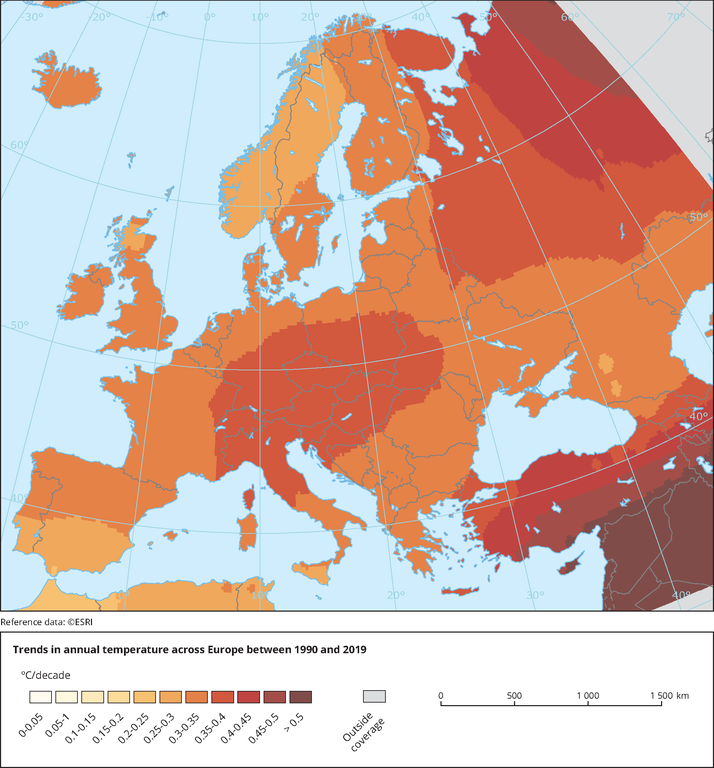
This is a simplified map of the map 3 in the CSI012. Only trends values are presented and not signifince (dots) and number of stations (outline).
Loading