All official European Union website addresses are in the europa.eu domain.
See all EU institutions and bodiesAn official website of the European Union | How do you know?
Environmental information systems
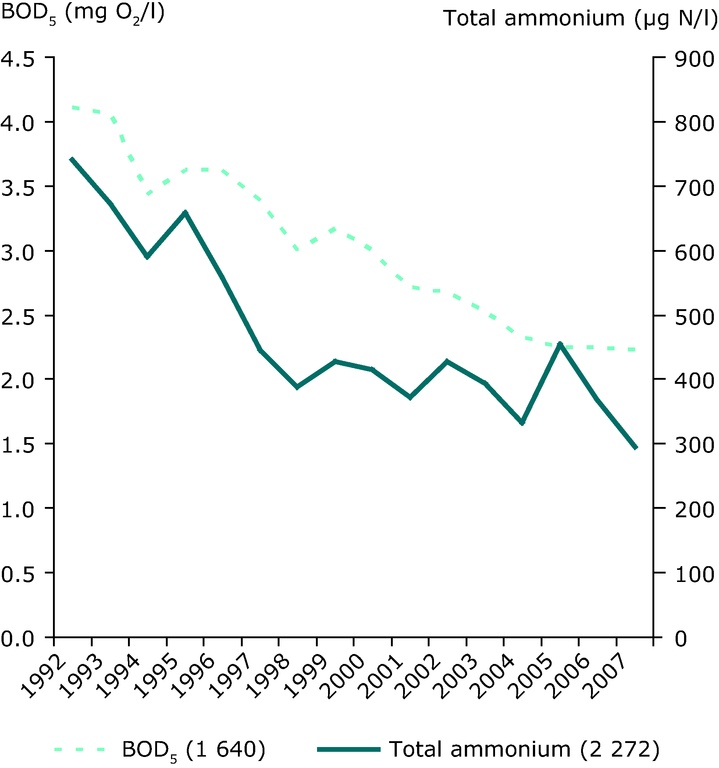
Biochemical Oxygen Demand (BOD5) and total ammonium concentrations in rivers between 1992 and 2007
Chart (static)
Numbers of river monitoring stations in brackets

Downloads
Data sources
Metadata
More info
Loading
- Austria
- Belgium
- Czechia
- Denmark
- Estonia
- Finland
- France
- Germany
- Hungary
- Latvia
- Lithuania
- Poland
- Slovakia
- Slovenia
- Sweden
1992-2007
How to read the graph: between 1992 and 2007, BOD5
decreased from 4 mg O2/l to 2 mg O2/l and ammonium
from 700 μg N/l to 300 μg N/l
