next
previous
items

Figure

Trend in the frequency of meteorological droughts in Europe (1950-2015)

Figure Created 25 Feb 2020 Published 23 Mar 2020 Last modified 02 Nov 2021
1 min read
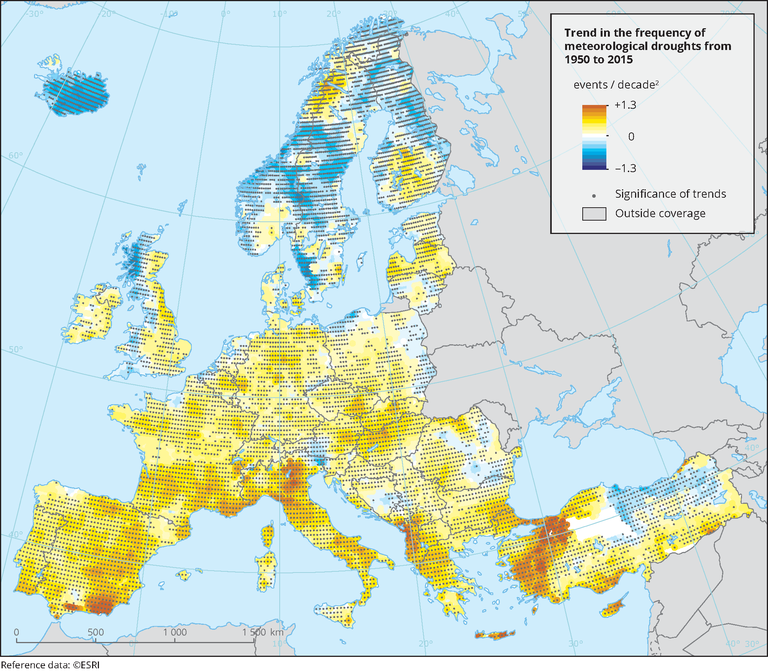
Hatching indicates the areas in which the trends are statistically significant at the 95 % percent level.

Metadata

Additional information

JRC: Sciene for Disaster Risk Management 2017, doi:10.2788/842809, Figure 3.35. A drought event is defined as a continuous period of at least two months in whicht the SPI-3 is below -1 (see Spinoni et al. 2017, doi:10.1016/j.gloplacha.2016.11.013).Trends are expressed in number of events per decade squared. For example, a trend of +1 means that a location will experience each decade, on average, one drought event more than in the previous decad.

Permalinks

Geographic coverage

Temporal coverage

Tags

Filed under:
Filed under: climate change, drought
Document Actions