All official European Union website addresses are in the europa.eu domain.
See all EU institutions and bodies
An official website of the European Union | How do you know?
Environmental information systems
EN

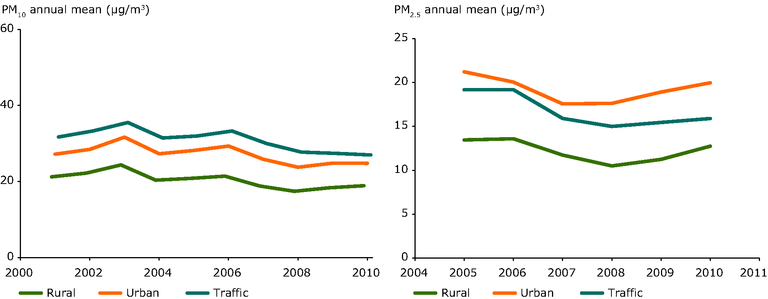
All stations in EU Member States, with at least 75 % data coverage for at least eight years (PM10) or six years (PM2.5), were included in the analysis. Concentrations per station type are given in μg/m3. In the diagrams a geographical bias exists towards central Europe where there is a higher density of stations.
Loading