All official European Union website addresses are in the europa.eu domain.
See all EU institutions and bodiesAn official website of the European Union | How do you know?
Environmental information systems
EN
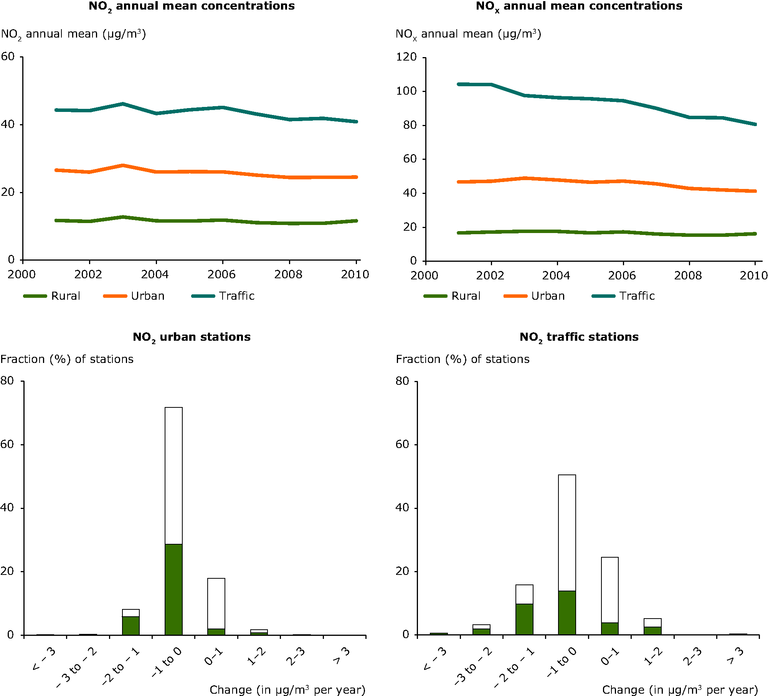
All stations in EU Member States, with at least 75 % data coverage for at least eight years were included in the analysis. Concentrations per station type are given in μg/m3. In the top two diagrams a geographical bias exists towards central Europe where there is a higher density of stations.
In the percentage frequency distribution graphs, closed bars denote stations showing a statistically significant trend, open bars denote stations with a non-significant trend. Statistically significant trends (level of significance 0.1) are calculated by applying the Mann-Kendall test. The applied method is described in de Leeuw, 2012.
Loading