All official European Union website addresses are in the europa.eu domain.
See all EU institutions and bodiesAn official website of the European Union | How do you know?
Environmental information systems
EN
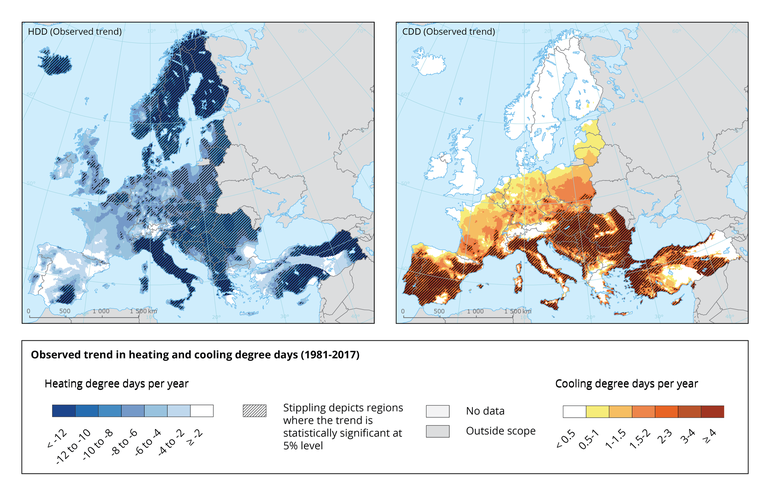
These maps show observed linear trends in heating degree days (left) and cooling degree days (right) over 1981–2017 for all EEA member and cooperating countries. Stippling depicts regions where the trend is statistically significant at the 5% level.
Loading