Figure
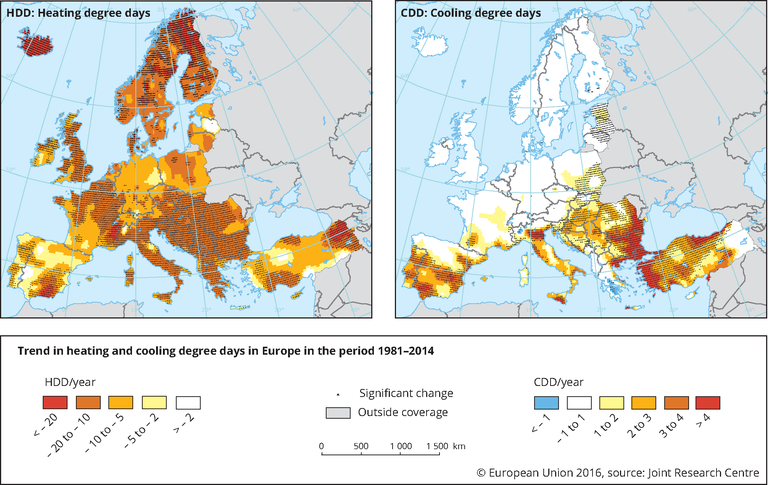
Trend in heating and cooling degree days (1981-2014)
Download
- Map 5.17 CCIV 68122-Trend-in-heating-and-cooling-v8-significant.eps.75dpi.gif (635.9 KB)
- Map 5.17 CCIV 68122-Trend-in-heating-and-cooling-v8-significant.eps.75dpi.tif (7.3 MB)
- Map 5.17 CCIV 68122-Trend-in-heating-and-cooling-v8-significant.eps.75dpi.png (202.9 KB)
- Original file application/postscript (7.05 MB)
Metadata
Additional information
Beware: some inconsistencies due to the input data might be found in Latvia, Southern Spain and North-Western Italy.
Permalinks
- Permalink to this version
- f2a5588e42b543d4be499359c34ca617
- Permalink to latest version
- 2PGBO4J71R
Geographic coverage
Temporal coverage
For references, please go to https://www.eea.europa.eu/data-and-maps/figures/trend-in-heating-and-cooling or scan the QR code.
PDF generated on 22 Apr 2021, 02:45 AM
Document Actions
Share with others