next
previous
items

Figure

Trend in freight transport demand and GDP

Figure Created 12 Nov 2009 Published 12 Nov 2009 Last modified 29 Nov 2012
1 min read
Topics:
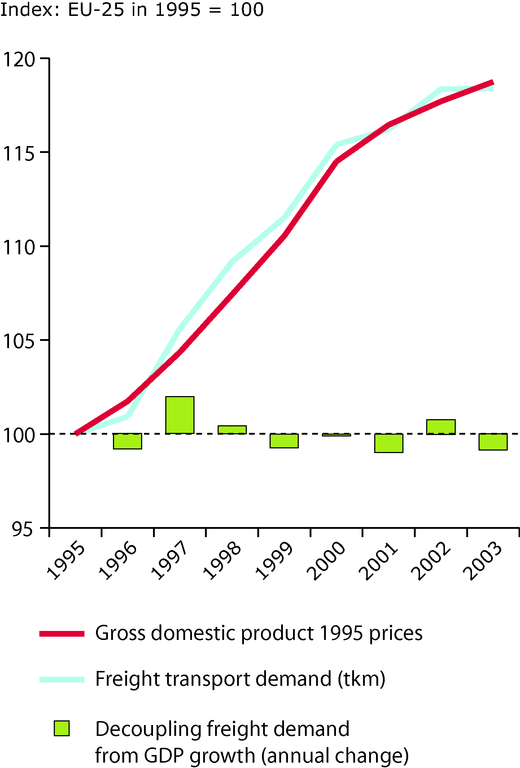
The decoupling indicator is calculated as the ratio of freight transport demand to GDP measured in 1995 market prices

Download

European data

Metadata

Additional information

The bars depict the intensity of transport demand in the current year in relation to the intensity in the previous year. An index above 100 results from transport demand outpacing GDP growth (i.e. positive bar = no decoupling) whereas an index below 100 is explained by transport demand growing less rapidly than GDP (i.e. negative bar = decoupling). See also indicator definition.

Permalinks

Geographic coverage

Topics

Topics:

Tags

Filed under:
Filed under: csi, transport
Document Actions