All official European Union website addresses are in the europa.eu domain.
See all EU institutions and bodiesAn official website of the European Union | How do you know?
Environmental information systems
EN
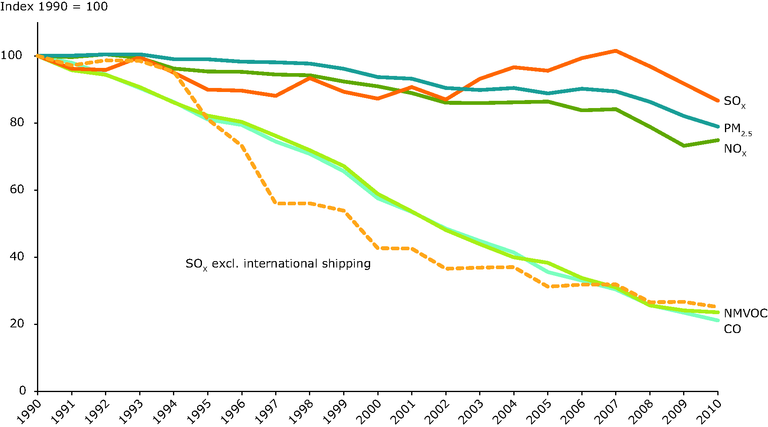
Transport emissions of PM2.5, CO, SOx, NMVOC, NOx in EEA member countries.
Loading