All official European Union website addresses are in the europa.eu domain.
See all EU institutions and bodiesAn official website of the European Union | How do you know?
Environmental information systems
EN
Loading
All official European Union website addresses are in the europa.eu domain.
See all EU institutions and bodiesChart (static)
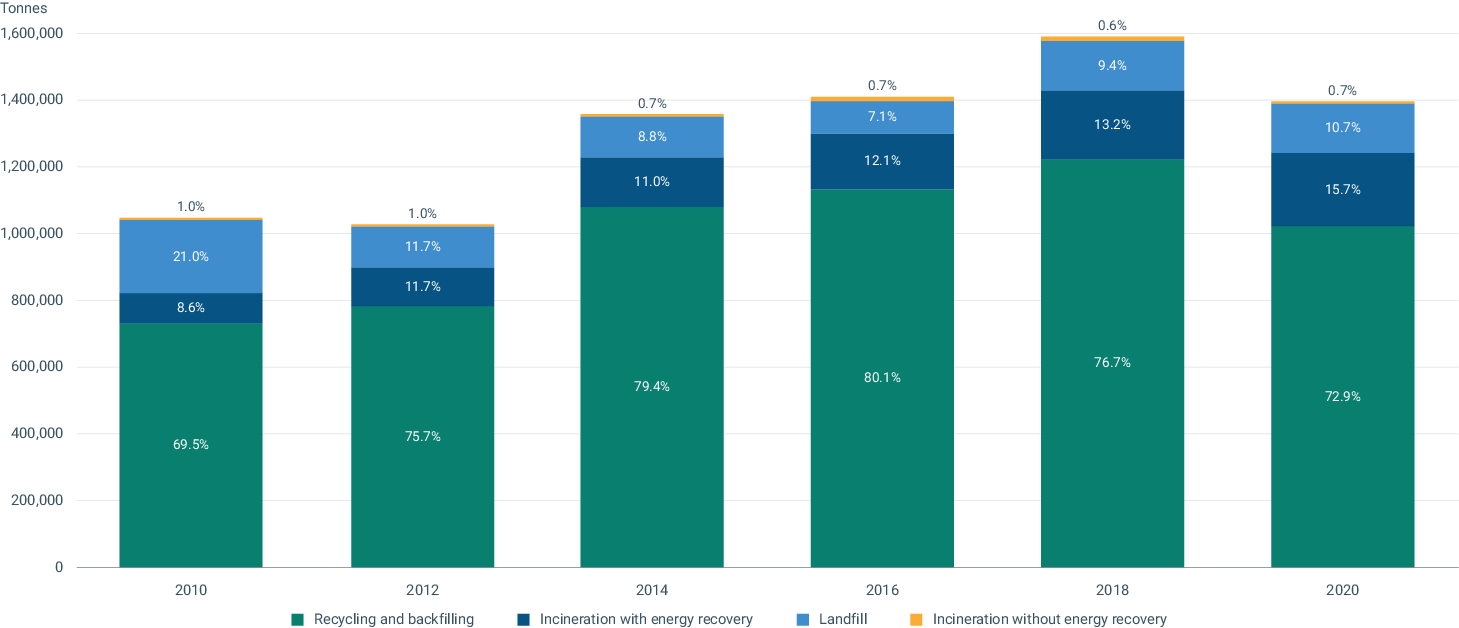
Backfilling involves using textile waste, often in the form of shredded or compacted materials, to fill empty spaces or voids in the ground, such as abandoned mines or excavations. Czechia is the only country that reports this treatment method regarding textile waste.