All official European Union website addresses are in the europa.eu domain.
See all EU institutions and bodies
An official website of the European Union | How do you know?
Environmental information systems
EN

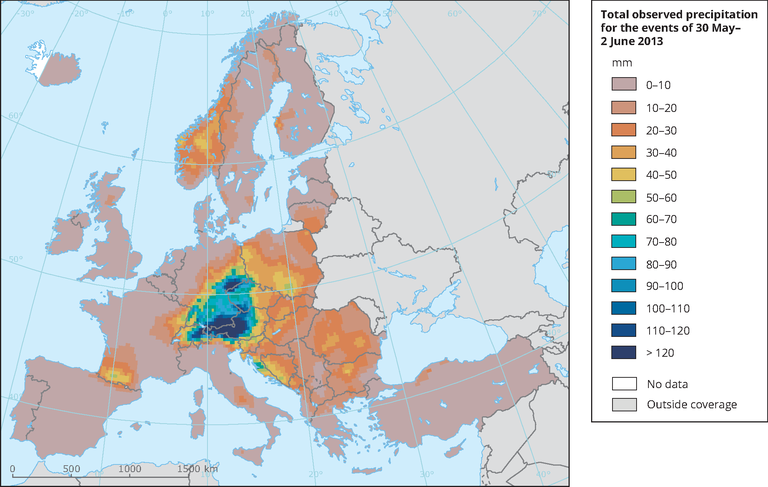
Map shows cumulative precipitation amount over the period between 30 May and 2 June 2013.
Loading