All official European Union website addresses are in the europa.eu domain.
See all EU institutions and bodies
An official website of the European Union | How do you know?
Environmental information systems
EN

- БългарскиBG
- češtinaCS
- HrvatskiHR
- danskDA
- NederlandsNL
- ελληνικάEL
- EnglishEN
- eestiET
- SuomiFI
- FrançaisFR
- DeutschDE
- magyarHU
- ÍslenskaIS
- italianoIT
- LatviešuLV
- lietuviųLT
- MaltiMT
- NorskNO
- polskiPL
- PortuguêsPT
- RomânăRO
- slovenčinaSK
- SlovenščinaSL
- EspañolES
- SvenskaSV
- TürkçeTR
Total municipal waste generated in the EU-27 over period 2004-2020 and projections for period 2018-2030
Chart (static)
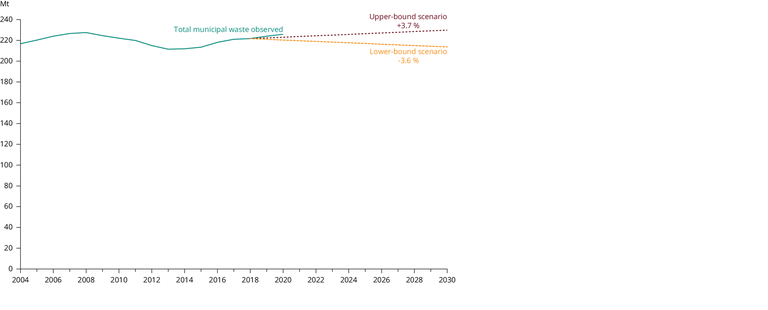
The projection of a 3.7% increase is based on the amount of waste per capita (1996-2018) and Eurostat population projections, and considers the differences in waste generation among the EU Member States. The projection of a 3.6% decrease considers a linear trend using total municipal waste data from 2004 to 2018. Neither projection takes into account the latest available data (2019/2020).
Downloads
Data sources
Metadata
More info
Loading
- Municipal waste by waste management operations (env_wasmun)
- Austria
- Belgium
- Bulgaria
- Cyprus
- Czechia
- Denmark
- Estonia
- Finland
- France
- Germany
- Greece
- Hungary
- Ireland
- Italy
- Latvia
- Lithuania
- Luxembourg
- Malta
- Netherlands
- Poland
- Portugal
- Romania
- Slovakia
- Slovenia
- Spain
- Sweden
- United Kingdom
2004-2030
Methodology
The observed municipal waste (from 2004 to 2020) is taken from the Eurostat dataset, while the projections (from 2018 to 2030) consider an European Commission report that predicts municipal waste by 2030 will either increase 3.7 % or decrease 3.6 %, when comparing with 2018 values
Additional information
The 3.7 % increasing projection is based on per capita waste amount (1996-2018) and Eurostat population projections, and considers the differences in waste generation among the different EU members, while the other (3.6 % decrease) considers a linear trend using total municipal waste data from 2004 to 2018. Neither projection takes into account the latest available data (2019/20).
There is no downloadable dataset for the "Scoping study to assess the feasibility of further EU measures on waste prevention: final report" (European Commission, Directorate-General for Environment, Karigl, B., Neubauer, C., Kral, U., et al., Scoping study to assess the feasibility of further EU measures on waste prevention: final report, 2022, https://data.europa.eu/doi/10.2779/21588). The European Commission report contains two different projections until 2035, and the current figure is based on the same annual increase for the two projections until 2030 as in the Commission report.