All official European Union website addresses are in the europa.eu domain.
See all EU institutions and bodies
An official website of the European Union | How do you know?
Environmental information systems
EN

- БългарскиBG
- češtinaCS
- HrvatskiHR
- danskDA
- NederlandsNL
- ελληνικάEL
- EnglishEN
- eestiET
- SuomiFI
- FrançaisFR
- DeutschDE
- magyarHU
- ÍslenskaIS
- italianoIT
- LatviešuLV
- lietuviųLT
- MaltiMT
- NorskNO
- polskiPL
- PortuguêsPT
- RomânăRO
- slovenčinaSK
- SlovenščinaSL
- EspañolES
- SvenskaSV
- TürkçeTR
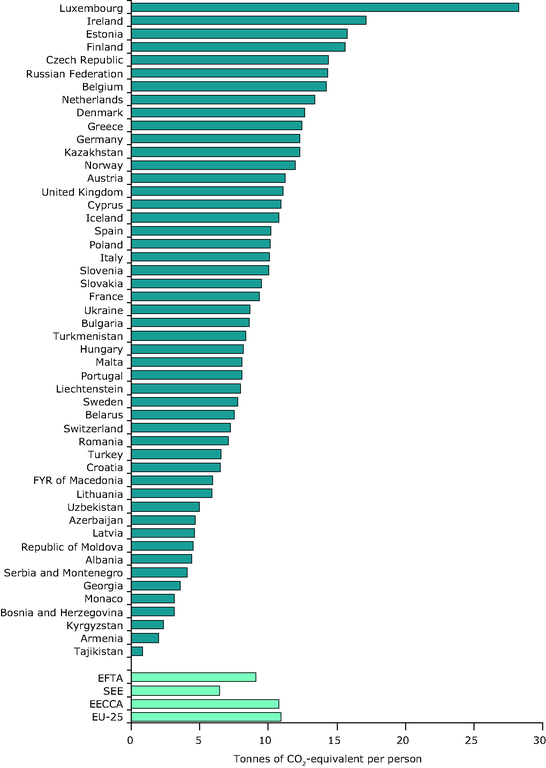
Total greenhouse gas emissions per capita in 2004
Chart (static)
Total greenhouse gas emissions are based on sectoral reported data by gas, mostly to the UNFCCC
Downloads
Data sources
Metadata
More info
Loading
- Albania
- Armenia
- Austria
- Azerbaijan
- Belarus
- Belgium
- Bosnia and Herzegovina
- Bulgaria
- Croatia
- Cyprus
- Czechia
- Denmark
- Estonia
- Finland
- France
- Georgia
- Germany
- Greece
- Hungary
- Iceland
- Ireland
- Italy
- Kazakhstan
- Kyrgyzstan
- Latvia
- Liechtenstein
- Lithuania
- Luxembourg
- Malta
- Moldova
- Montenegro
- Netherlands
- Norway
- Poland
- Portugal
- Romania
- Russia
- Serbia
- Slovakia
- Slovenia
- Spain
- Sweden
- Switzerland
- Tajikistan
- Turkey
- Turkmenistan
- Ukraine
- United Kingdom
- Uzbekistan
For some countries where UNFCCC data, or official data provided by the country directly to the EEA, was not available, the IEA was the source of CO2 emissions from the energy sector. For some of these countries (Albania, Armenia, Bosnia and Herzegovina, Serbia and Montenegro) CH4 and N2O were estimated using the GAINS model. In some other countries (Georgia, Kyrgyzstan, Republic of Moldova, Tajikistan, Turkmenistan, Uzbekistan) N2O was not estimated. In the latter three (Tajikistan, Turkmenistan, Uzbekistan) estimates of N2O and CH4 were not available. As a result, total greenhouse gas emissions per capita, as presented in the chart above underestimate total greenhouse gases in these countries. The level of the underestimation is directly proportional to the size of the gas/gases not being included. Therefore, the country ranking does not necessarily provide a fair comparison of these countries vis à vis the countries where all gases were either officially reported or estimated.