All official European Union website addresses are in the europa.eu domain.
See all EU institutions and bodies
An official website of the European Union | How do you know?
Environmental information systems
EN

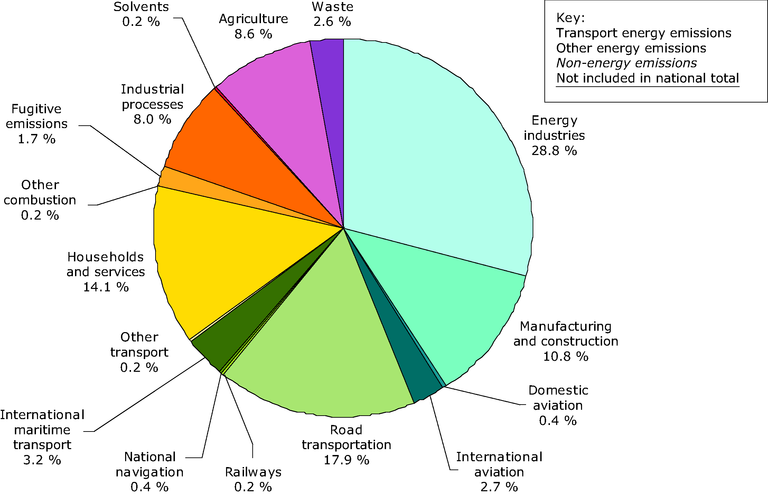
Annual emissions of CO2, CH4, N2O, HFC, PFC and SF6 in the UNFCCC reporting format are converted to their global warming potential GWP (100 year time horizon) for addition and comparison with the Kyoto Protocol targets: 1 t CH4 = 21 t CO2-equivalent, 1 t N2O = 310 t CO2-equivalent, 1 t SF6 = 23 900 t CO2-equivalent. HFCs and PFCs have a wide range of GWPs depending on the gas and emissions are already reported in tonnes CO2-equivalent. International transport emissions (Memo items: international aviation and international maritime transport) are shown in the chart because they are the fastest growing source of emissions in the EU. They are however not included in the national totals reported as part of the national greenhouse gas inventories under the UNFCCC.
Loading