All official European Union website addresses are in the europa.eu domain.
See all EU institutions and bodies
An official website of the European Union | How do you know?
Environmental information systems
EN

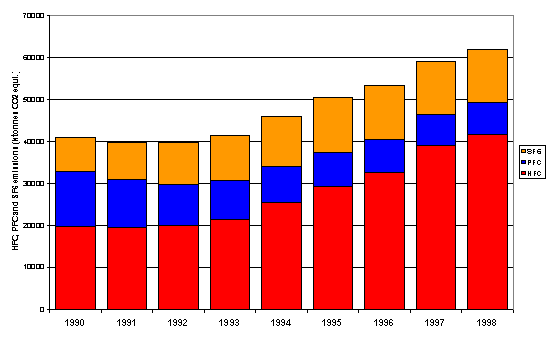
Notes: Emissions are expressed in Global Warming Potentials with different country specific values for each of the fluorinated gases.
Loading