All official European Union website addresses are in the europa.eu domain.
See all EU institutions and bodiesAn official website of the European Union | How do you know?
Environmental information systems
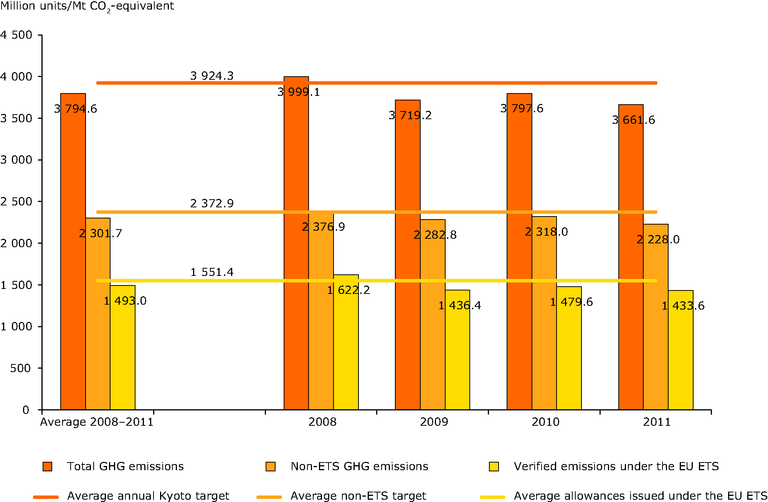
Total, ETS and non‑ETS emission trends in the EU‑15 compared to their respective targets, 2008–2011
Chart (static)
-

Downloads
Data sources
Metadata
More info
Loading
- Deliveries for projections and national programmes under Greenhouse gas monitoring mechanism
- Austria
- Belgium
- Denmark
- Europe
- Finland
- France
- Germany
- Greece
- Ireland
- Italy
- Luxembourg
- Netherlands
- Portugal
- Spain
- Sweden
- United Kingdom
2008-2011
