All official European Union website addresses are in the europa.eu domain.
See all EU institutions and bodies
An official website of the European Union | How do you know?
Environmental information systems
EN

-
Loading
All official European Union website addresses are in the europa.eu domain.
See all EU institutions and bodiesChart (static)
-
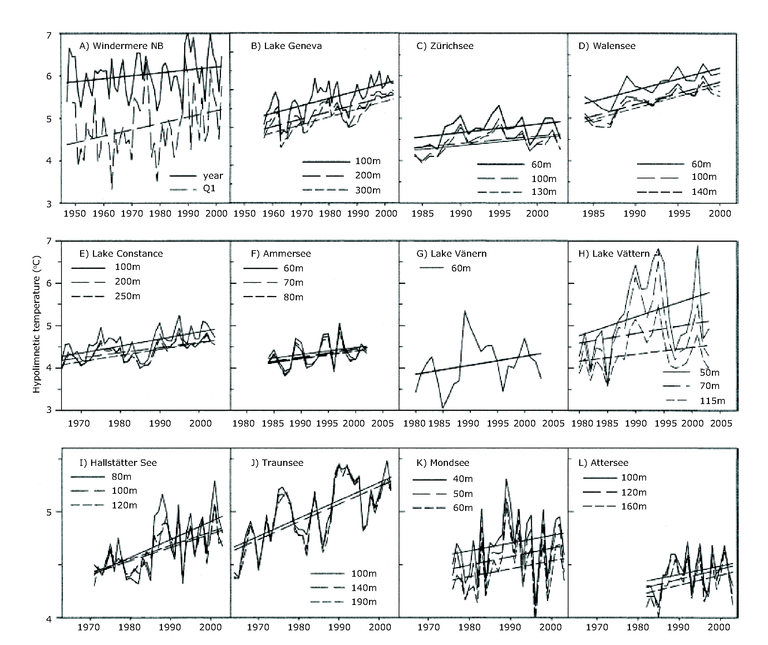
(A) Windermere North Basin 60 m and the first 10-week period (Q1), (B) Lake Geneva, (C) Zürichsee, (D) Walensee, (E)
Lake Constance, (F) Ammersee, (G) Lake Vänern, (H) Lake Vättern, (I) Hallstättersee, (J) Traunsee, (K) Mondsee, and (L)
Attersee for the depths indicated . T-increase in all lakes was 0.1–0.2 °C/decade.