All official European Union website addresses are in the europa.eu domain.
See all EU institutions and bodiesAn official website of the European Union | How do you know?
Environmental information systems
EN
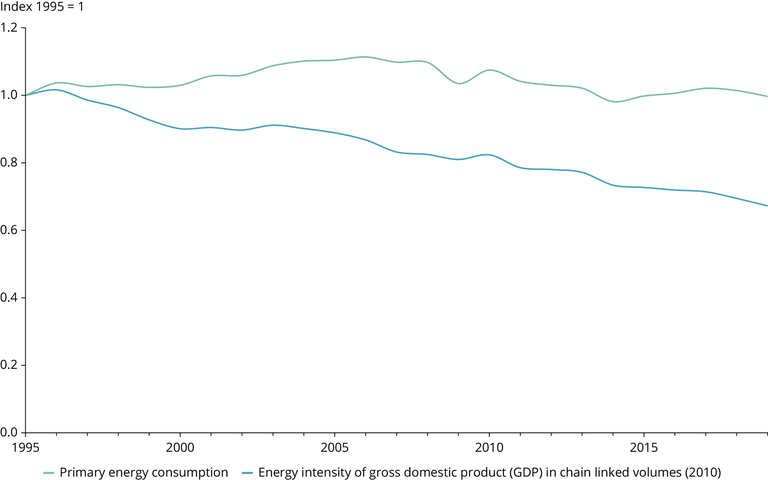
The chart shows how primary energy consumption in the EU-27 has not changed substantially in the period indicated in the chart, despite a fast-paced reduction in energy intensity of the economy, as a result of the Jevons paradox.
Loading