All official European Union website addresses are in the europa.eu domain.
See all EU institutions and bodies
An official website of the European Union | How do you know?
Environmental information systems
EN

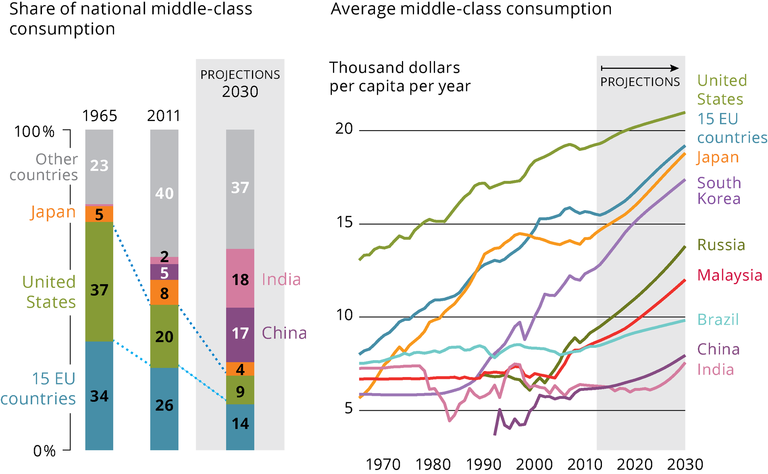
The left panel of the figure shows the average middle class consumption per capita for selected world regions/countries. Middle class is defined as people living in households earning and spending between 10 and 100 per person per day (2005 US dollars, in purchasing power parity).
Loading