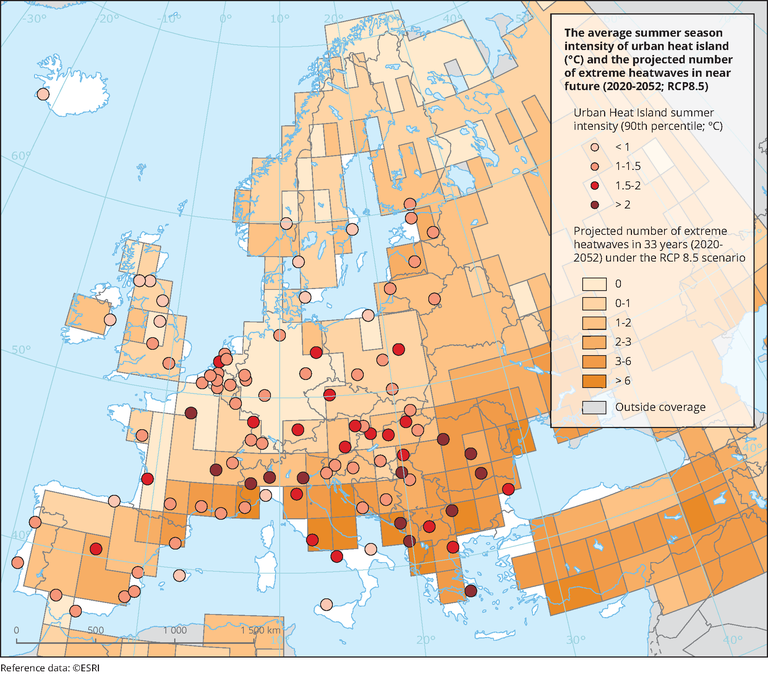
The intensity of UHI was estimated for 100 European cities in the framework of the Copernicus European Health contract for the Copernicus Climate Change Service (C3S). High resolution (100m) hourly temperature (2008-2017) was simulated with the urban climate model UrbClim (De Ridder et al., 2015). Summer season is June, July and August. The intensity of UHI is represented by spatial P90 (90th percentile) UHI intensity of a given city. This indicator is calculated by subtracting the rural (non-water) spatial P10 (10th percentile) temperature value from the average, height-corrected (to exclude terrain effects), air temperature map. For information on individual cities and detailed modelling of the UHIs for the 100 European cities see the Urban Adaptation Map Viewer.
Source: Author’s compilation based on EEA (2019e) and VITO (2019)