All official European Union website addresses are in the europa.eu domain.
See all EU institutions and bodiesAn official website of the European Union | How do you know?
Environmental information systems
EN
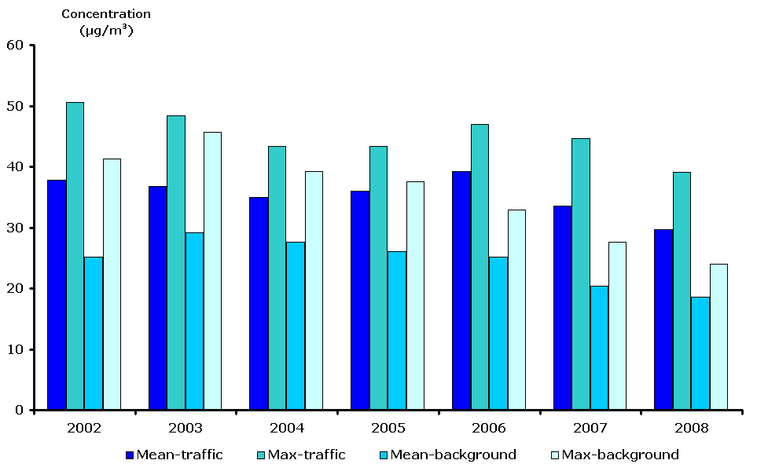
Station pairs from capital cities were preferred, but when not available the next largest city for which data was available was chosen
Loading