All official European Union website addresses are in the europa.eu domain.
See all EU institutions and bodies
An official website of the European Union | How do you know?
Environmental information systems
EN

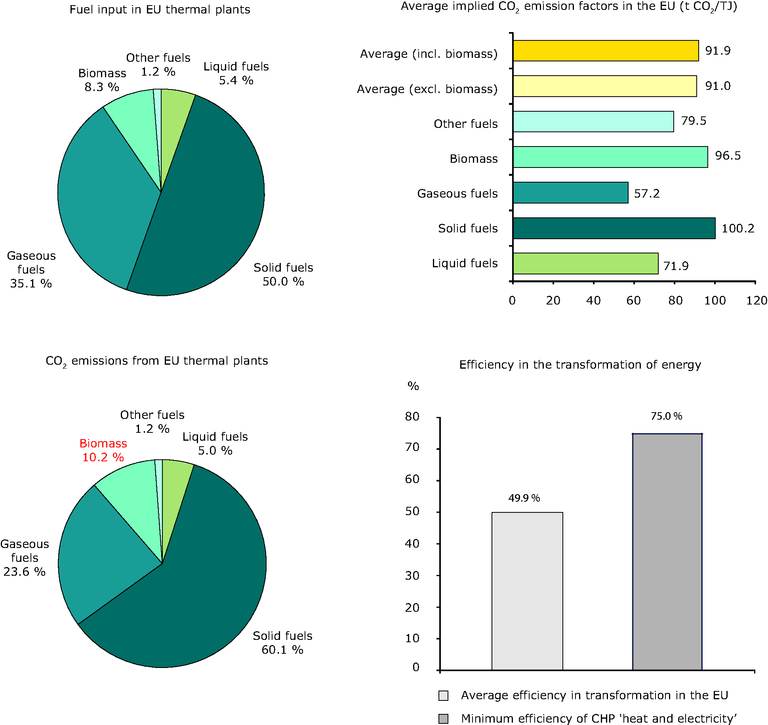
How to read the figures:
Left-top: % Share of fuel input (TJ) by type (liquid, solid, gaseous, biomass and other fuels) into 1A1a public electricity and heat production.
Left-bottom: Implied emission factor for each fuel above (tCO2 / TJ), taken from EEA (2009)
Right-top: Average efficiency of transformation in EU-27.
Numerator = 101109 Output from district heating plants + 101121 Output from public thermal power stations
Denominator = 101009 Input to district heating plants + 101021 Input to public thermal power stations
Right-bottom: % Share of CO2 emissions by fuel type (liquid, solid, gaseous, biomass and other fuels into 1A1a public electricity and heat production)
Loading