All official European Union website addresses are in the europa.eu domain.
See all EU institutions and bodies- БългарскиBG
- češtinaCS
- HrvatskiHR
- danskDA
- NederlandsNL
- ελληνικάEL
- EnglishEN
- eestiET
- SuomiFI
- FrançaisFR
- DeutschDE
- magyarHU
- ÍslenskaIS
- italianoIT
- LatviešuLV
- lietuviųLT
- MaltiMT
- NorskNO
- polskiPL
- PortuguêsPT
- RomânăRO
- slovenčinaSK
- SlovenščinaSL
- EspañolES
- SvenskaSV
- TürkçeTR
Statistically significant trends of ocean colour intensity 1998–2009
Map (static)
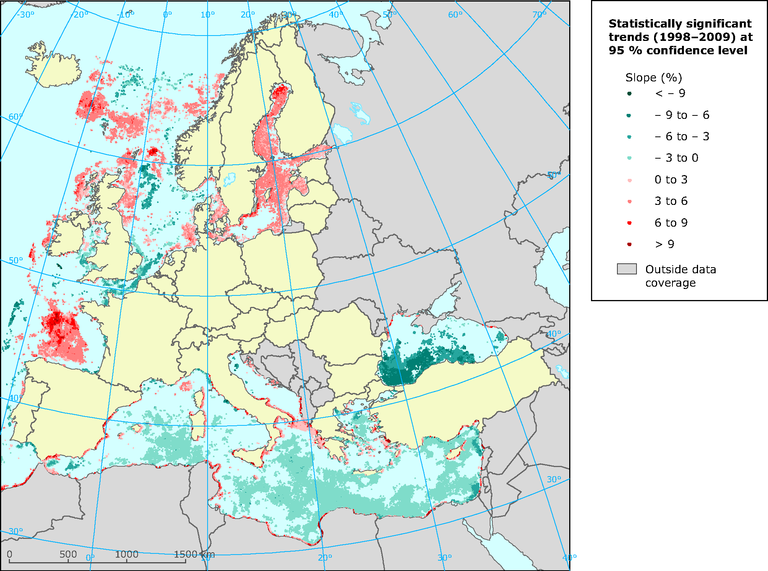
The figure shows statistically significant trends of ocean colour intensity 1998–2009 at the 95 % confidence level (Mann–Kendall test)

- Albania
- Belgium
- Bosnia and Herzegovina
- Bulgaria
- Croatia
- Cyprus
- Denmark
- Estonia
- Finland
- France
- Germany
- Greece
- Iceland
- Ireland
- Italy
- Latvia
- Lithuania
- Malta
- Montenegro
- Netherlands
- Norway
- Poland
- Portugal
- Romania
- Russia
- Serbia
- Slovenia
- Spain
- Sweden
- Turkey
- United Kingdom
Methodology
For each grid point a time series of summer mean Chl-a concentration was calculated for the period 1998-2009, using the same definition of summer as in the observations. The trend in these time series are tested for significance using the Mann-Kendall test.
Additional information
This analysis is based on satellite observations of ocean colour which is equivalent to chl-a. A global dataset covering the period 1998-2009 and without regional corrections has been used. This dataset is most accurate in the Mediterranean Sea. In the Black Sea, few in-situ observations are available and the satellite imagery is unverified. In the Baltic Sea high concentrations of humic substances in the sea requires a regional correction of the satellite observations, making the analysis less certian in this area.