All official European Union website addresses are in the europa.eu domain.
See all EU institutions and bodies
An official website of the European Union | How do you know?
Environmental information systems
EN

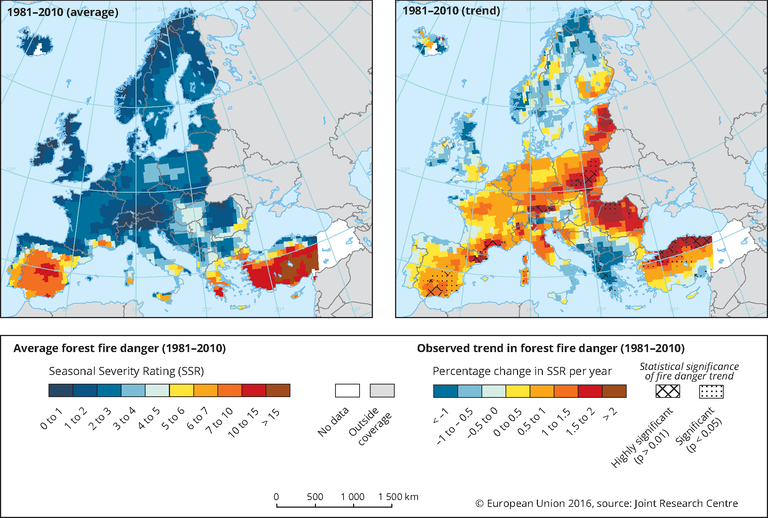
The left panel shows the average SSR values during the period 1981 to 2010 whereas the right panel shows the linear trend in the same period.
Loading