All official European Union website addresses are in the europa.eu domain.
See all EU institutions and bodies
An official website of the European Union | How do you know?
Environmental information systems
EN

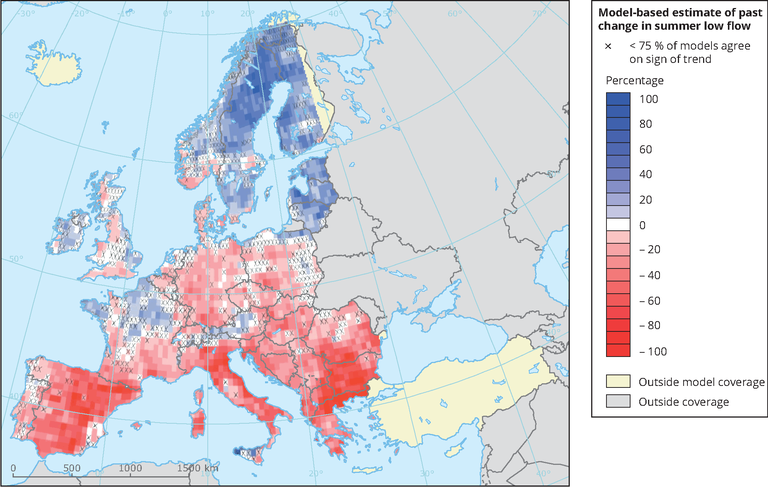
This map shows the ensemble mean trend in summer low flow from 1963 to 2000. ‘x’ denotes grid cells where less than three- quarters of the hydrological models agree on the direction of the trend.
Loading