All official European Union website addresses are in the europa.eu domain.
See all EU institutions and bodies
An official website of the European Union | How do you know?
Environmental information systems
EN

- БългарскиBG
- češtinaCS
- HrvatskiHR
- danskDA
- NederlandsNL
- ελληνικάEL
- EnglishEN
- eestiET
- SuomiFI
- FrançaisFR
- DeutschDE
- magyarHU
- ÍslenskaIS
- italianoIT
- LatviešuLV
- lietuviųLT
- MaltiMT
- NorskNO
- polskiPL
- PortuguêsPT
- RomânăRO
- slovenčinaSK
- SlovenščinaSL
- EspañolES
- SvenskaSV
- TürkçeTR
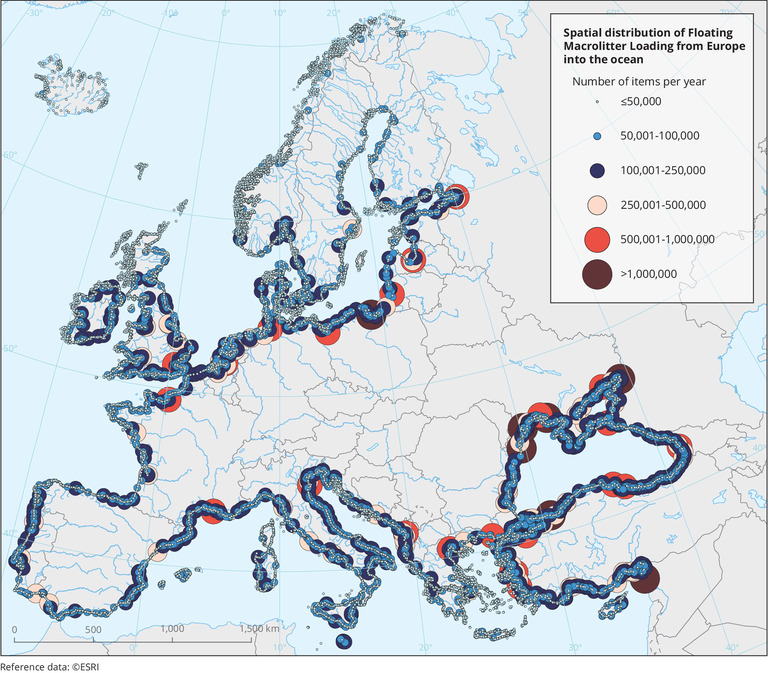
Spatial distribution of Floating Macrolitter Loading from Europe into the ocean
Map (static)
Downloads
Data sources
Metadata
More info
Loading
- Albania
- Austria
- Baltic Sea
- Belgium
- Black Sea
- Bosnia and Herzegovina
- Bulgaria
- Croatia
- Cyprus
- Czechia
- Denmark
- Eastern Mediterranean
- Estonia
- Finland
- France
- Georgia
- Germany
- Greece
- Hungary
- Iceland
- Ireland
- Italy
- Kosovo (UNSCR 1244/99)
- Latvia
- Liechtenstein
- Lithuania
- Luxembourg
- Malta
- Montenegro
- Netherlands
- North Atlantic Ocean
- North Macedonia
- Norway
- Poland
- Portugal
- Romania
- Russia
- Serbia
- Slovakia
- Slovenia
- Spain
- Sweden
- Switzerland
- Turkey
- Ukraine
- United Kingdom
- Western Mediterranean
2010
2015-2017